By Zak Winnick
A recent post from Zutobi with a headline most coverage skimmed past. For the first time in years, public charging infrastructure in the United States grew faster than the EV fleet itself. The vehicle count rose 26.7 percent year over year. The port count rose 34.6 percent. The ratio of chargers to electric vehicles, after a long stretch of slipping backward, finally turned the other way.
That is genuinely good news, and it deserves to be read as such. It is also worth reading twice.
The report draws on the Alternative Fuels Data Center for its port counts, which combine every kind of public EVSE into a single number. Level 2 chargers in apartment garages, workplace ports, retail destination charging, and DC fast charging on the interstate corridors all sit in the same column. For a homeowner with a garage and a daily commute, that is the right column. For a family driving five hundred miles between Friday and Sunday, it is not. The headline ratio improves. The ratio that actually matters on a road trip, the count of high-power chargers along the highways drivers care about, improves more slowly. The two numbers move in the same direction. They do not move at the same speed.
We read this report the way we read every other piece of charging data that comes across our desk. Not as a scoreboard, but as a question. Where is the experience of charging about to matter most?
The answer is in the data, if you know where to look.
Texas now sits with the second-largest EV fleet in the country, somewhere near 295,000 registered vehicles, growing roughly thirty percent year over year. The state’s charging count grew over thirty percent too, and yet the state’s geography keeps doing what Texas geography does. Cities sit far apart. Interstates carry long, sustained driving distances. The ratio of chargers per hundred EVs in Texas is now one of the lowest in the country, with fast-charging supply along the I-10, I-20, I-35, and I-40 corridors carrying disproportionate weight.
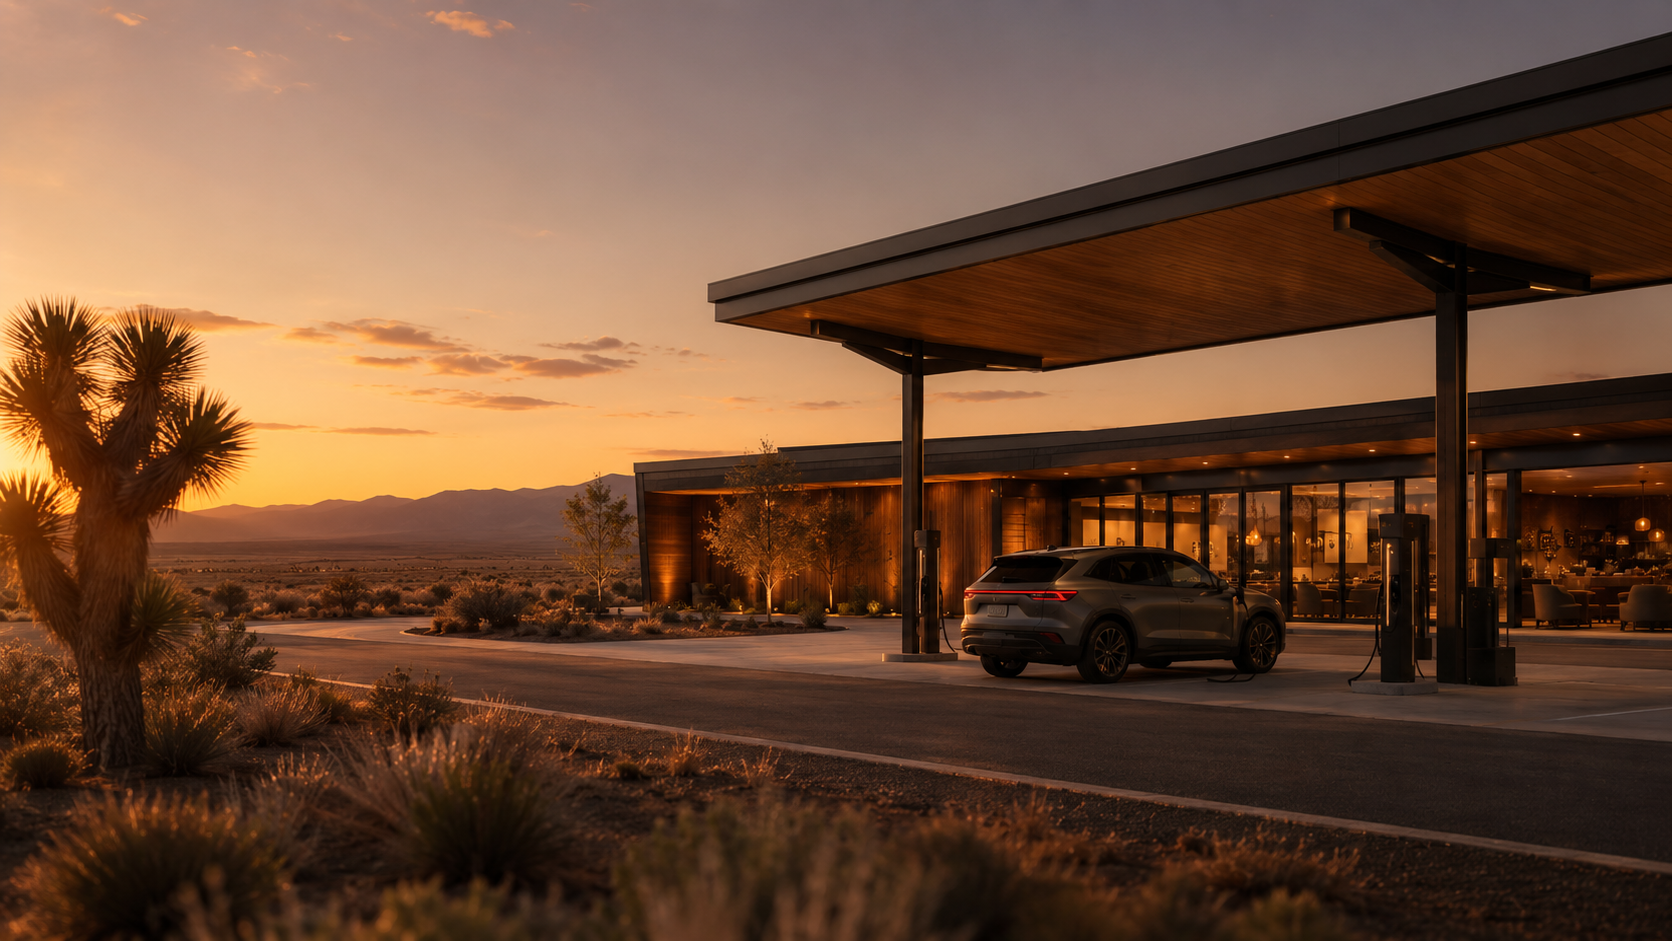
Nevada tells a similar story for different reasons. The state grew its EV fleet by 38.5 percent last year, the fourth-largest jump nationally, and now sits at nearly eight percent EV penetration. That is not a coincidence. Nevada drivers spend more of their road time on long inter-city drives than drivers almost anywhere else, the I-15 and US-93 corridors carry the overflow of California’s EV adoption into the rest of the West, and Las Vegas runs one of the densest EV rideshare and taxi fleets in the country. Demand is acute. Supply is catching up in absolute terms and falling behind in functional terms.
Florida belongs in the same conversation. Roughly 31 percent EV growth year over year, with a charger-to-EV ratio that puts it near the bottom of the table. The traffic on I-75 and I-95 during high season is some of the heaviest sustained inter-city travel on the eastern seaboard. The supply pressure on those corridors is going to keep building, and the pressure is going to keep landing on the stops.
The states at the other end of the table are interesting too. Michigan led the country in EV registration growth last year, up over fifty percent, with Louisiana close behind at forty-two and Colorado at forty-one. Connecticut and New York led on charging build-out, growing their port counts by more than seventy percent each. The market is not moving uniformly. Some states are adding cars faster than ports. Some are doing the reverse. Where the curves cross is where the stop becomes the friction point in the trip.
This is where the report stops being a chart and starts being a brief.
None of this is really about ports. Ports are a means. The question underneath all of these numbers is what happens during the time a driver is stopped. Twenty or thirty minutes is the median session. Multiply that by the millions of sessions occurring in markets where supply and demand are most out of phase, and you get a very large number of hours, every day, that drivers are spending in parking lots waiting on electrons.
Those hours are either time wasted or time worth something. That is the actual question.
A fueling stop on an ICE road trip lasts five minutes and is not asked to be more than itself. A charging stop is structurally different. The duration is long enough that the experience around it determines whether the trip felt like a trip or felt like a series of inconveniences. The states where the charger ratio is tightest are also the states where the experience of charging carries the most weight, because the dwell time is unavoidable, the volume of drivers is growing, and the alternatives are limited.
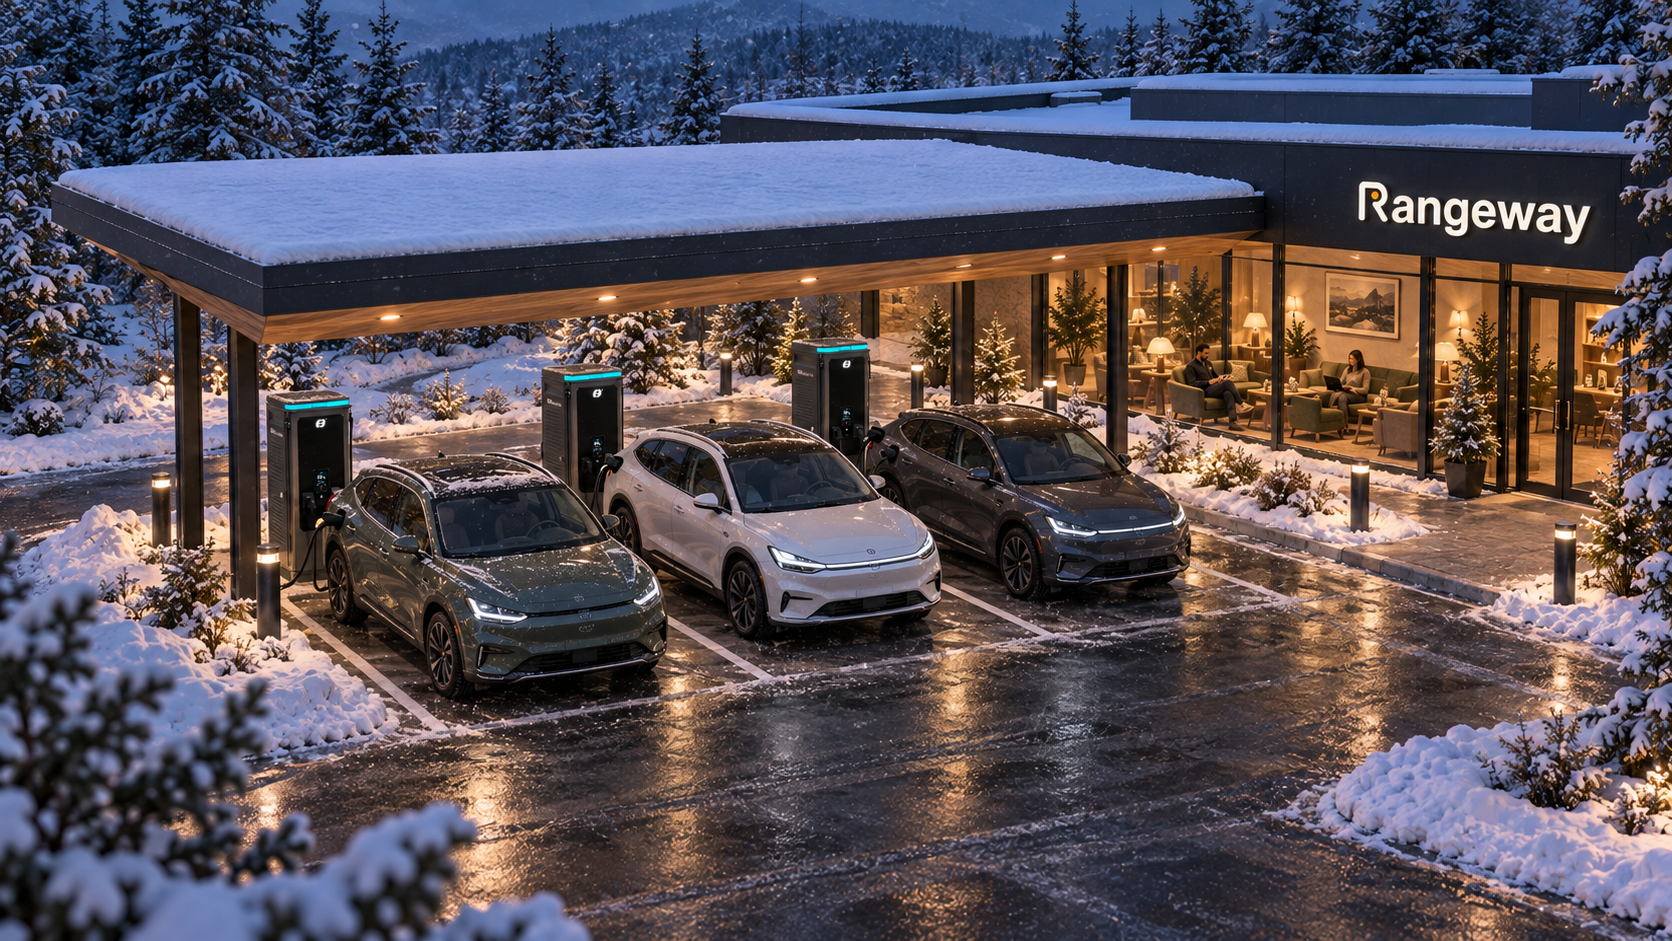
We think like hotel operators, not utility companies. That is not a tagline so much as a posture toward this exact problem. When the data says the supply pressure is moving toward a particular corridor or state, our reading is not where to put another bay of chargers. Our reading is what the stop should feel like once the driver gets there. A premium driver’s lounge with climate control, real seating, a clean restroom, and a working internet connection is the difference between a trip and an errand. A staffed cafe with quality coffee turns a thirty-minute stop into a moment. Lookouts at a Summit, where the road meets rest, turn the stop into the trip itself.
The 2026 report has its useful headline. Charging infrastructure is, at long last, growing faster than the cars. Take the win.
The reading underneath the headline is the one we keep coming back to. The build-out is uneven. The pressure is concentrating on specific corridors and specific states. The drivers showing up on those corridors next summer are going to make their own decisions about which stops are worth their time, and the stops that are worth their time will be the ones built for a stop in the first place.
We are paying attention to where those stops need to be.
Source: Zutobi, The 2026 EV Charging Station Report: State-by-State Breakdown, updated April 16, 2026. Methodology draws on the Alternative Fuels Data Center and the Bureau of Transportation Statistics.
Learn more about how we are building the network at rangeway.co.